Seismic Interpretation
The
Santa Margarita exercise consists of a two-dimensional (2D) seismic line
(Figure 6) and wireline-log and a synthetic seismic trace from one well
(Figures 7 and 8). These data provide an excellent opportunity to interpret
seismic-stratal patterns (i.e., downlap, toplap, onlap, and erosional
truncation; Mitchum et al., 1977) and to identify unconformities formed by
tectonically or eustatically induced base-level changes. Following the methods
of Mitchum et al. (1977), Weimer and Sonnenberg (1989), Van Wagoner et al.
(1990), and Posamentier and Allen (1999), the unconformities identified can be
interpreted as sequence boundaries or lowstand-surfaces of erosion; and marine-flooding
surfaces (Van Wagoner et al., 1990) or transgressive-surfaces of erosion
(Weimer and Sonnenberg, 1989).
The quest is to complete a
sequence-stratigraphic interpretation that is consistent between the seismic
and wireline-log data.This is accomplished iteratively by using a synthetic
seismogram to tie the seismic and well data. Thus, stratigraphic-stacking
patterns as expressed by the wireline logs can be extended laterally (and
mapped) using the seismic-stratal patterns.
Click thumbnail images for display of large images. Right click on large images for better resolution.
Figure 6:Uninterpreted west-to-east 2D seismic line from the San Joaquin Basin,
California. Data for Well No. 1 are given in Figure 8. The stratigraphic
interval of interest is denoted by the red arrow.
Interpretation
Methodology
1. On
the 2D seismic line:
a. Use
a red colored pencil and mark the termination point of reflections within the
interval defined by the red arrow. See Figure 4: Mitchum et al. (1977) for an
example.
2. Transfer
the seismic stratal surfaces to the wireline-logs by matching surfaces with the
SP and synthetic on Figures 7 and 8. Keep in mind that the synthetic and
seismic data do not match exactly.
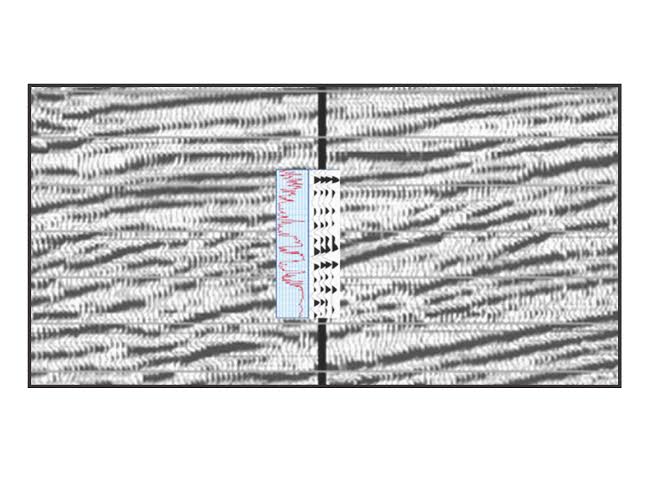
Figure 7: Uninterpreted Spontaneous Potential
(SP) and induction (ILD) induction wireline logs from Well #1 tied to a
synthetic seismogram
 |
Images in the data set in this exercise section and for the exercise section that follows can be printed or imported into electronic media that include PC, Notebook, Tablet, or Pad. Using Power Point drawing tools in the electronic media is an effective and easy way to handle the objectives of the exercise and a means for collective viewing of results in class. Click on red box for more details in a separate tab. |
Figure 8:.Uninterpreted Spontaneous
Potential (SP) and induction (ILD) wireline logs from Well #1 tied to a
synthetic seismogram.
6. Interpret
systems tracts on the seismic line and wireline logs. Color them by this convention:
Figures 9 and 10 show one interpretation.
7. Summarize your
interpretation with a brief discussion of how this stratigraphic interval may
have formed regarding the balance between base-level change and sedimentation
rate, what type(s) of depositional systems might be present within each systems
tract, and predict where in the section, away from the Well #1 location,
reservoir-quality sediments, seals, and traps would likely occur.
8. M
ake recommendations as
to whether the seismic-reflection character is indicative of lithology and/or
porosity.
9.
Paleobathymetry Estimate: Measure the slope
relief along a clinoform in the thickest part of the wedge. The slope relief
provides an estimate of the minimum paleobathymetry for compacted sediments and
helps in the prediction of the presence of a deepwaterlowstand system seaward
of the slope. To convert from seismic two-way time to thickness, assume 100
milliseconds = 500 feet.
Figure 9: Interpreted
Spontaneous Potential (SP) and induction (ILD) induction wireline logs from
Well #1 tied to a synthetic seismogram showing stratigraphic-stacking patterns,
interpreted key (i.e., sequence stratigraphic) stratigraphic surfaces, and
systems tracts.
SeismicInterpretation
Highstand progradational wedge
A series of seismic
clinoforms uniformly converge onto a basal downlap surface and toplap and/or
are erosionally truncated against an upper surface.The two surfaces define a
progradational wedge with a distinct shelf-slope morphology. Slope relief is
about 1500 feet.clinoform relief increases to the west suggesting the system
built into ever-increasing water depths.
2. A continuous
reflection immediately overlying the toplap/truncation surface suggesting
regional erosion and subsequent marine transgression.The overlying
transgressive systems tract is thin (a single reflection) likely due to
abundance of lateral (rather than vertical) accommodation.
3. Concave-upward features near the top of the
wedge and landward of the shelf edge suggest base-level lowering and
fluvial-valley incision
Seismic-Log Integration
The seismic downlap
surface is correlated to the base of the oldest parasequence and is interpreted
as a maximum-flooding surface or condensed section.Seaward of this area, the
condensed section is the stratigraphic equivalent of chert-rich deepwater
suspension sediments (i.e., “O-chertmarker”) of the Monterey formation.Four
parasequences defined on the log correlate to approximately four clinoforms
withinthe progradational-highstand wedge.The toplap/truncation surface (i.e.,
sequence boundary) ties within a sand-rich interval.This significant surface is
not an obvious surface picked from the well data alone.Seaward of the
depositional shelf break and slope is the time equivalent Bellevue Member of
the Miocene Stevens turbidite system (Figures 11 and 12). The Bellevue thins
and onlaps landward onto the slope of a progradational wedge in this
exercise. See Figures10, 11, and 12. This Upper Miocene petroleum system is
summarized in Figure 13.
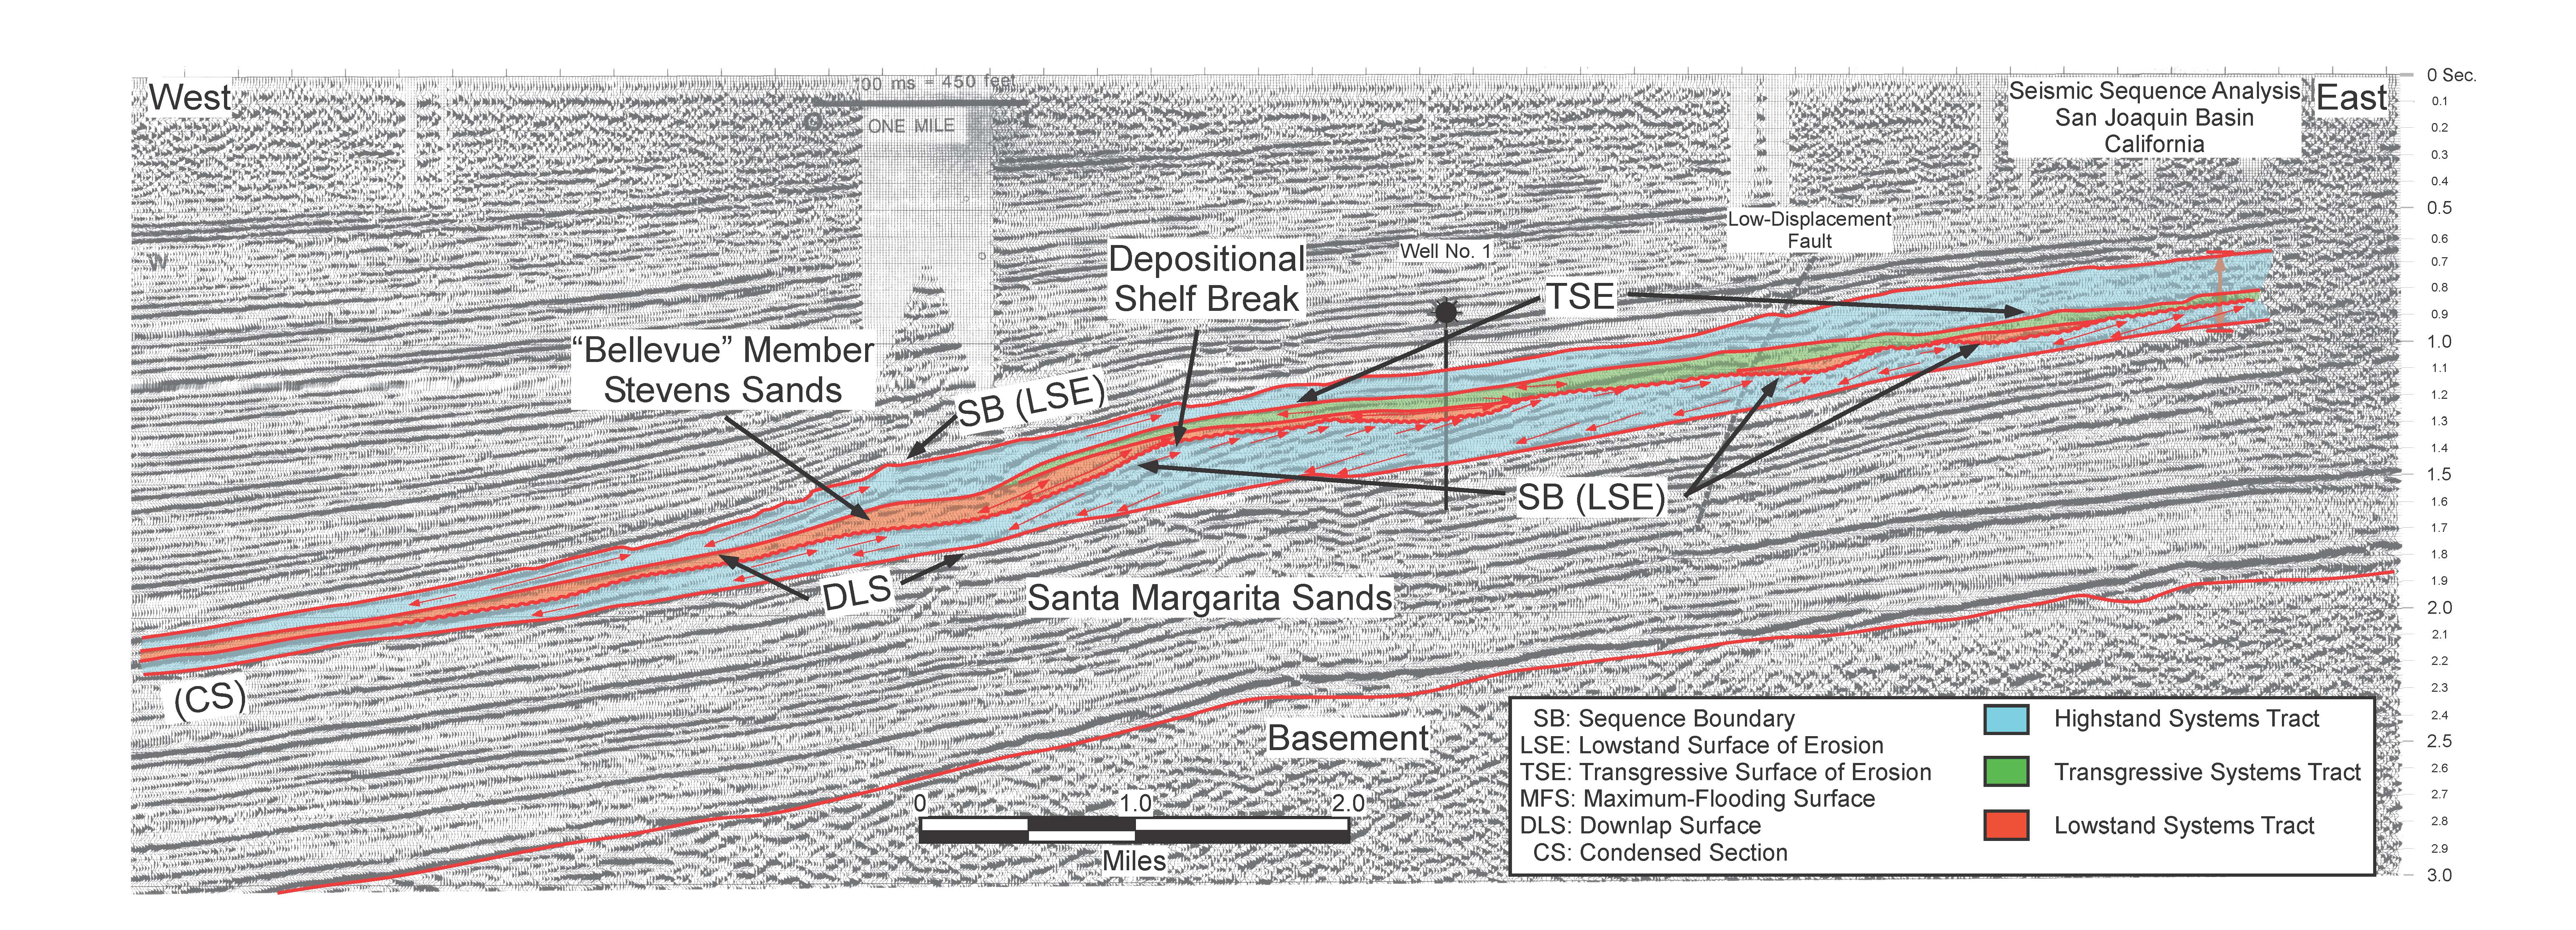
Figure 10: Interpreted
west-to-east 2D seismic line from the San Joaquin Basin, California. The
stratigraphic interpretation from Well No. 1 is imposed on the seismic data. S
tratal
terminations and their geometries on the 2D line enable the
interpretation of
systems tracts within the
depositional sequence.
Figure 11: Paleogeographic reconstruction of the progradational shelf, incised valleys, turbidite channels and turbidite lobes of the Bellevue Member of the Stevens formation. Well 1 of the Santa Margarita exercise and its corresponding seismic line are shown. In addition, inverted L-shaped wireline-log and seismic cross sections traverse five oil fields and display six wells tied to seismic data.
Figure 12: Wireline-log and 2D
seismic sections showing stacked Stevens Sand submarine-fan lobes. chert beds
deposited during periods of no- to minmal-sedementation (i.e., highstand)
constitute condensed sections separating successive lobes. Sections pass
through five oil fields. Seismic line and well locations shown in Figure 11.
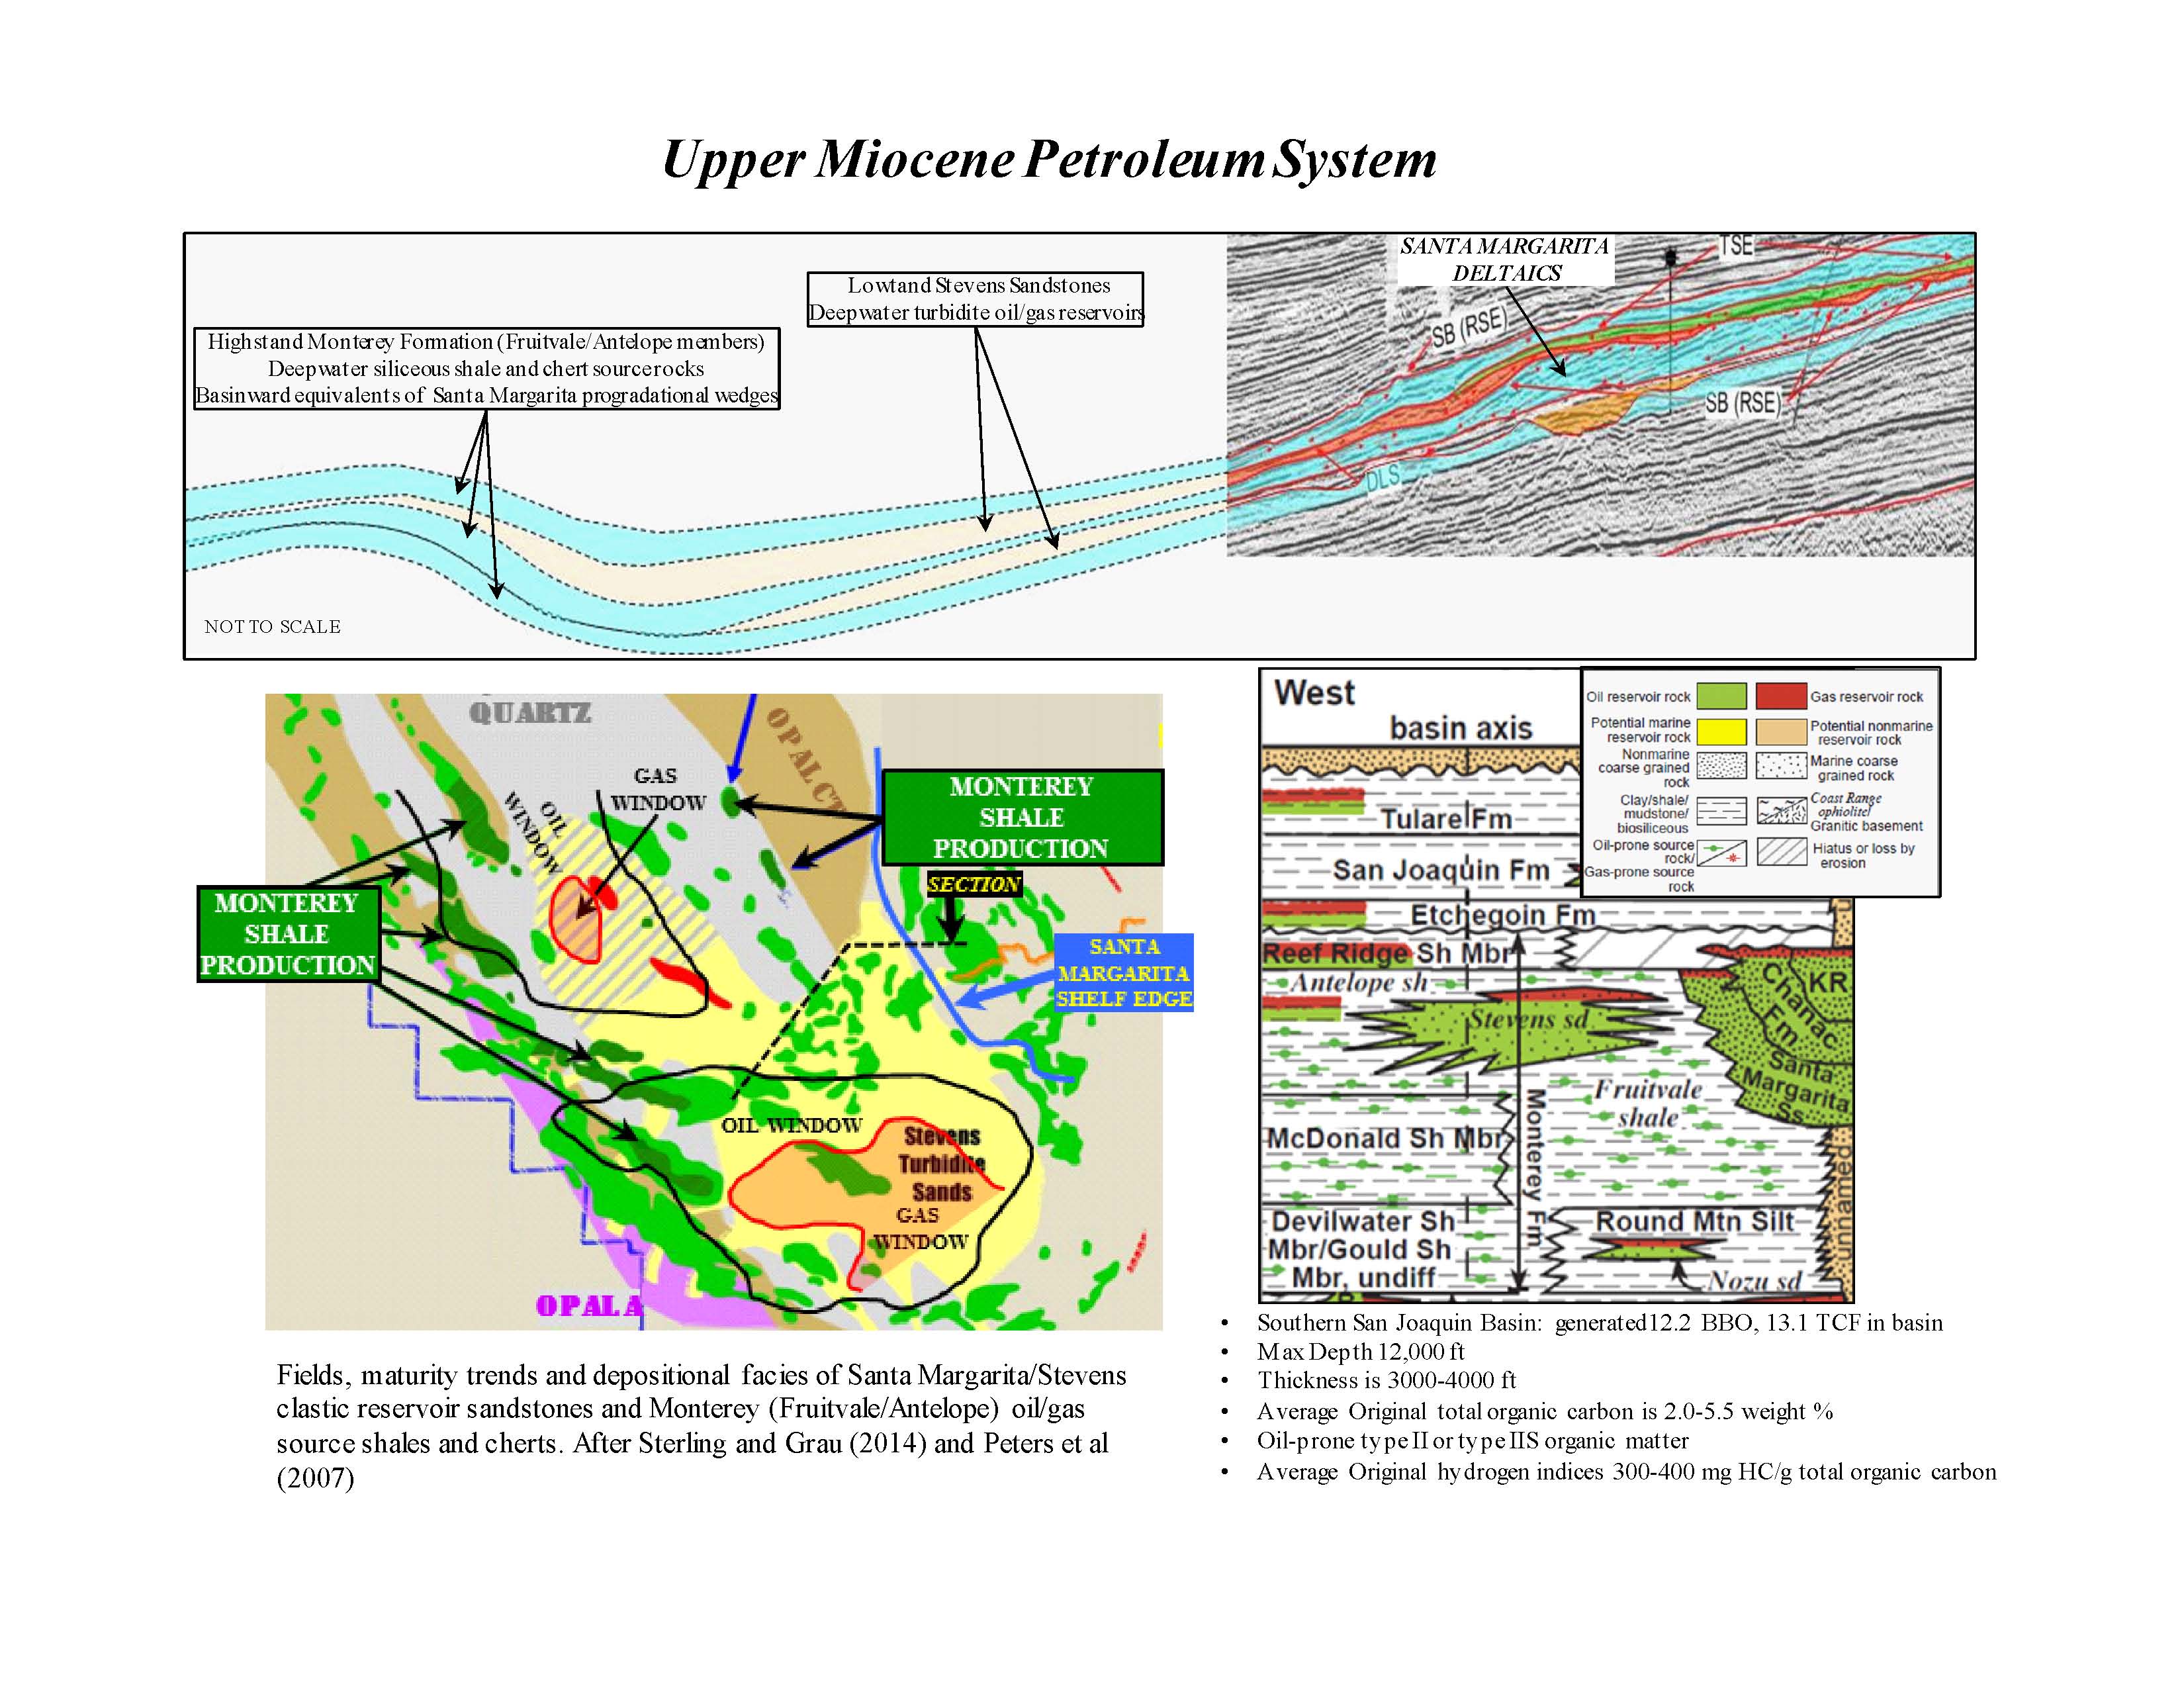 Figure 13: Summary of the Upper Miocene
petroleum system; southern San Joaquin Basin, California.
Figure 13: Summary of the Upper Miocene
petroleum system; southern San Joaquin Basin, California.
Contributed by James S. Hewlett and Robert S. Tye, PhD., P.G.