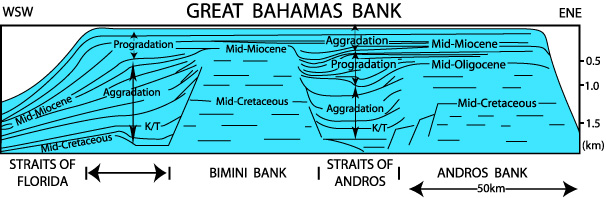
The North-East South-West regional seismic seismic of the exercise crosses an approximately linear depression, known as the Andros Channel, had a depth of around 500 m (1500 ft) in the Late Tertiary (Eberli and Ginsburg 1997, Eberli et al 1994). This depression appears to have been filled from the Oligocene to close to the end of the Miocene by a series of enormous wedges of prograding carbonate slope sediment that extended westwards over basinal carbonates,and were capped by aggrading shelf carbonates. The timing of the fill of this depression is inferred on the basis of wells drilled on the line and to the North West. Never-the-less the exact ages of the sequences of the sedimentary section are not known (Sen and Kendall 1999).
Type I, second order seismic sequence boundaries can be identified on a seismic cross section for West Andros. These can be used as brackets to correlate enclosed third order events with an eustatic sea level curve.
The Early Neogene fill of the Straits of Andros is assumed to have had an uncomplicated and uniform tectonic setting. This simplification means that the sea level cycle chart of Haq et al. (1987), updated for the Neogene with the absolute ages provided by Berggren et al. (1995 can be matched to the interpreted seismic. This exercise asks the question can the amplitude and ages of the sea level changes as shown in the eustatic chart be used to date the sequence boundaries for the Neogene of the Straits of Andros. Does this mean that seismic sections can be dated using sequence stratigraphic geometries when the biostratigraphic data is poor?
Most sequence stratigraphers interpreting seismic lines are confronted with the difficulty of determining: a) the ages of sequence boundaries interpreted on the seismic (Miall 1990); and b) the size of eustatic sea level changes associated with those (Burton et al., 1988).
You will use the principles of sequence stratigraphy to interpret a seismic cross section, that records the Neogene carbonate fill of the Straits of Andros in Great Bahamas Bank. At the heart of this study is the recognition that eustatic events are evidenced in sedimentary sections by the presence of synchronous sedimentary sequences and the unconformities that bound them (Vail et al., 1978). These eustatic events produce changes in the accommodation for sedimentary fill that have worldwide extent. Their chronostratigraphic correlation is dependent upon reliable time markers spaced sufficiently close in time to bracket the sediment packages formed in response to changes in sea level. The measurement of the amplitudes of sea level events on the sea level charts are dependent on assumptions related to the rates of subsidence and sediment accumulation for the regions in which the charts were created (Burton et al., 1988).
However there appears to be no direct method available to measure these amplitudes of sea level variation. This is because there is no datum available to measure from, particularly since the earth surface constantly moves in response to 1) sediment compaction, 2) isostatic response to sediment loads, and 3) thermal tectonic movement (Burton et al., 1988). The relative positions of sea level are thus dependent on tectonic behavior and eustatic position, and the size of either of these two variables can only be measured by assuming a model for the other's behavior.
Methods used to measure sea level indirectly have to assume models of tectonic behavior. Such methods include tide gauges, strandline position (which assume a continental relief in addition to tectonic behavior), paleobathymetry, seismic sequence onlap, stacked subsidence curves, and the matching of sequence geometries with graphical simulations (Burton et al., 1988). Despite the fact that sea level amplitudes cannot be measured independently stratigraphic predictions based on eustatic sea level curves and/or tectonic models of behavior can be reproduced and verified away from areas of interest. This is because the onlapping or downlapping of sediment geometries are dependent on rates of sedimentation, tectonic movement and sea level position. So if it is assumed that the sea level fluctuations are the same at different locations, any change in accommodation will be the product of the local tectonics and sedimentation. However, in a particular area, if rates of subsidence and of carbonate accumulation are constant for several cycles in eustatic sea level, the frequency and amplitude of the onlapping sequence geometries will be the product of the frequency and amplitude of the changes in eustatic sea level. The hypothesis you will examine is: Do the sequence geometries interpreted on seismic line match the events on the eustatic sea level curve, and then can the ages of these latter sequences have the same timing as the former. The shallow water carbonate platform of Strait of Andros in Bahamas provides a perfect opportunity to test this hypothesis.
Assumptions
It is assumed that there was a uniform rate of subsidence and a high rate of constant sediment accumulation, for several sea level cycles. The resultant accommodation and its fill is sufficient to be recorded on the seismic section for the Neogene of the Bahamas platform. The changing onlapping position of the sequence geometries are assumed to have been produced through several cycles of sea level change and to be independent of tectonics. In the absence of absolute sea level markers for a paleoshore, it is assumed that the rate of sedimentation was sufficient to fill any shoreward accommodation to sea level. In this case the equivalent bedding plane and the shelf margin can then be used as a proxy of the sea level position. This assumption is a reasonable one for a carbonate shelf (especially in areas of high sediment production and low tectonic subsidence) and the identification of confirmatory paleobathymetric markers (Eberli et al., 1997) proves its validity. The reasonableness of this assumption can be seen in the seismic sections of the Neogene of the Bahamas. The sedimentary section developed is the product of carbonate accumulation rates high enough to fill the accommodation space up to sea level during each sea level cycle. In this case, the Neogene section is expressed by prograding clinoforms enveloped shoreward by aggrading horizontal shelfal units. In the Bahamas, this effect can be seen at both the western side of the bank and in an interior sea, the Straits of Andros (Eberli and Ginsburg 1989).
Interpretation of the sequence stratigraphy of a seismic line.
Introduction to the data set
The establishment of the sequence stratigraphy of the Straits of Andros involves an interpretation of carbonate platform based on the seismic data and the limited well control from the western Great Bahamas Bank.