seismic lines

Seismic Section

Haq et chartal chart

Gulf of Florida - Bahamas


More Topics


Seismic Sequence Analysis
Exercise Four - Objectives & Data

THE STRATIGRAPHY OF THE NEOGENE OF THE WESTERN BAHAMAS

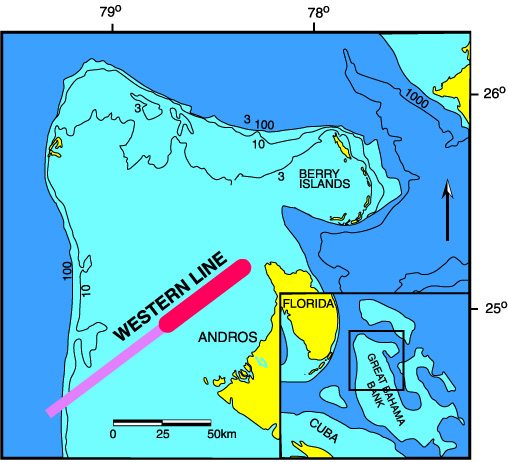
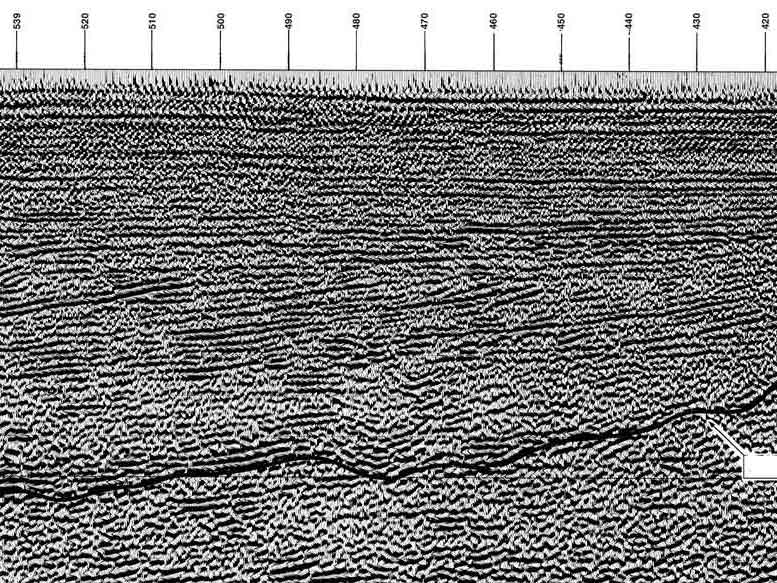
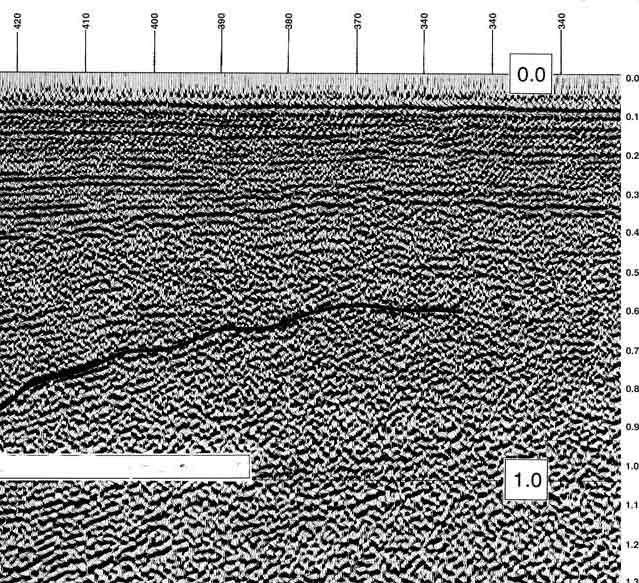
To gain access to the complete image containing the un-interpreted seismic section of the exercise, click on the appropriate image to download it in a series of images (each divided image can be printed on a regular 11" X 8.5" paper).

Complete seismic section (about 50" wide).This is an Adobe Acrobat ".pdf" file and as such may be the easiest to print from at any scale you need. If you choose the largest size the print out will consist of four landscape mode sheets that over lap and can be taped together.

- - - - These five images are linked to .jpg files. Most will find the full image above in .pdf format is easiest to print from. "Chacun a son goût" or to each their own taste!

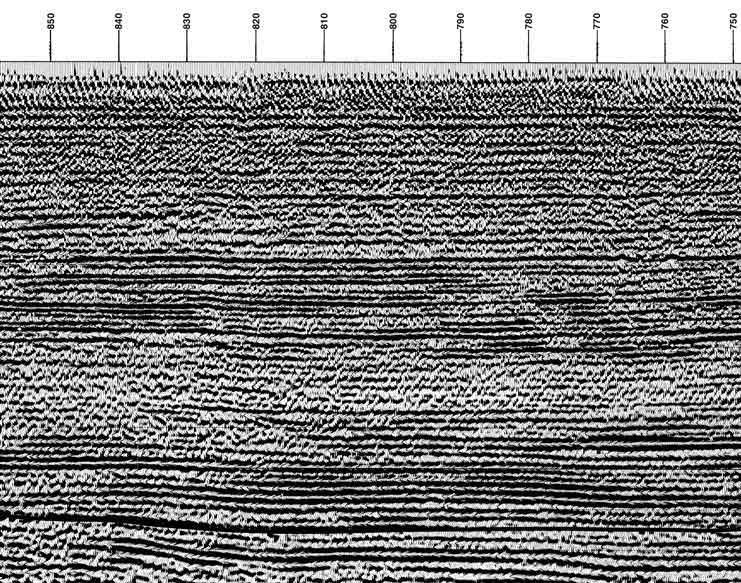
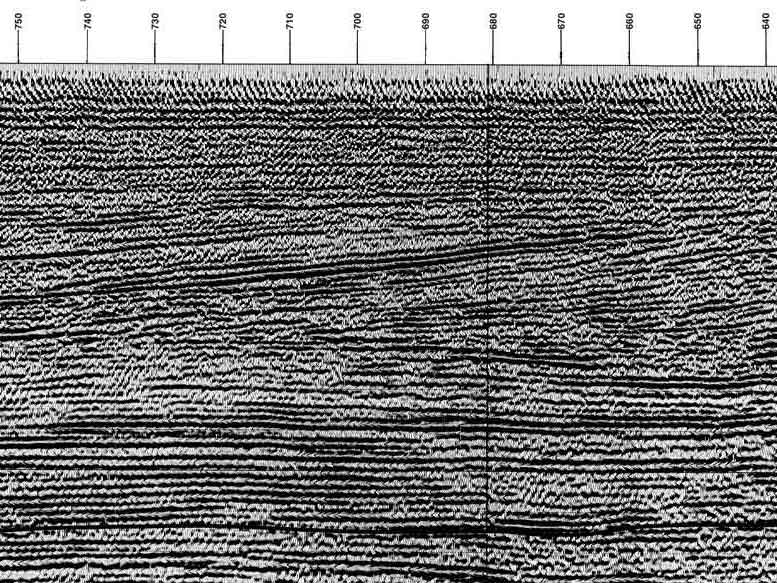
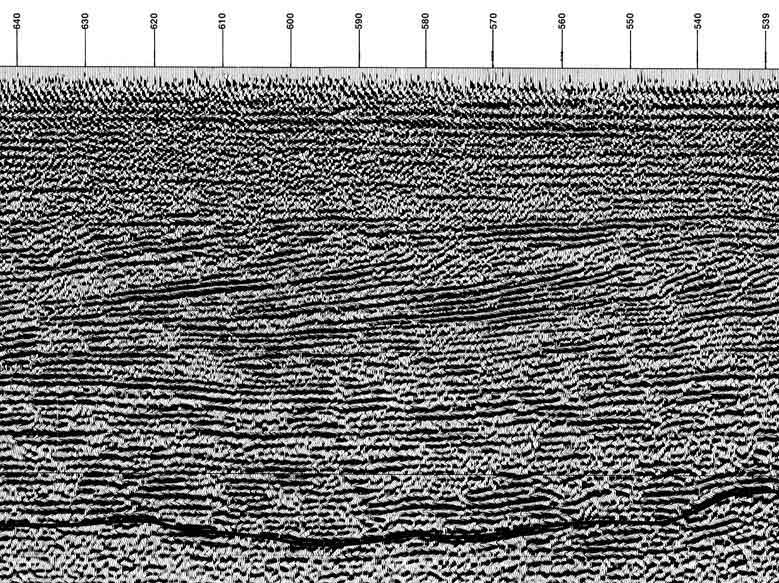
However you do it, once the 2D seismic line has been downloaded it will be seen that the line is divided in 5 segments. These segments of the line should be taped together to form a complete seismic line.

The objectives for this exercise are listed below. Start with 1) and work through to 4). Problem 3) may be considered as a dangerous call, but without tight biostratigraphic data the use of the Sea Level chart may be a best first pass as a tool for dating the stratigraphic section!!!


1) Determine the sequence stratigraphy of the line and the clinoformed sequences that form this Neogene sedimentary section by

a. Identifying the termination of seismic reflectors at discontinuity surfaces.
b. Establishing which of these surfaces form the sequence boundaries.
c. Numbering the sequence boundaries (there are around 15 or so).
d. Outlining and labeling the geometries of the sequences and the system tracts they enclose The movie of the Sedpak simulation of a sequence stratigraphic interpretation of this line exhibits the potential relationship of these sequences. A Sedpak simulation without a sequence stratigraphic interpretation but with a geometric interpretation can also be viewed.

2) Examine the sedimentary architecture of the clinoforms and infer the origins of these features. For instance do the clinoform geometries show evidence of shelf onlap and does the downlap show evidence of slumping related to the shifting base level? Was there a variable rate of sediment supply to the area of study? Is there evidence of widespread changes in base level? To answer these:

a. First track the varying thickness and widths of the clinoforms from one or sequence to the next.
b. What is the cause of the clinoforms? High rates of sedimentation relative to lower rates of subsidence and periodic changes in base level, or some sort of point source switching? Is point source migration to be expected in carbonates just as in siliciclastics?
c. Identify downslope slumps and see if they can be tied to any specific relative times on the Haq et al chart? Is there evidence that they were produced during changes in base level?
d. Identify and locate basin floor fans, and slope fans. Is there evidence that they were produced during changes in base level?
e. Identify and locate onlapping wedges of sediment (Figure). Is there evidence that they were produced during changes in base level?
f. Identify the crests of clinoformed margins that have been eroded or truncated and see if they can be tied to changes in base level?
g. Do the major eroded clinoform margins (i.e. basin crests) match the downslope slumps, and associated basin floor fans, and slope fans? If they do, how do you explain this relationship?

3) As indicated above poor biostratigraphic control means it is difficult to determine the ages of the individual clinoforms, never the less Sen and Kendall(1999) have been able to infer the ages of the progradational Neogene clinoforms using the Haq and others (1987) eustatic chart for the Neogene has some 14 major changes in sea level, at least some of which might be expected to produce major second order type 1 unconformities. There were marked sea level lows, particularly the major type 1 unconformities and associated lows, that suggest these may have been large enough to produce erosional events at the crests of the clinoforms displayed by the seismic sections. Below the exercise proposes examination of the erosional events on the seismic sections to see if these events can be tied to the changes in base level predicted on the Haq and others (1987) chart. If this can be done, is it possible to establish their relative timing? Is there a match between the onlapping and downlapping geometries of the clinoformed section and the Haq et al 1987 sea level curves:

a. Identify and count the 2nd and 3rd order "type one" unconformities and their related sequence boundaries on the seismic lines.
b. Generate chronostratigraphic charts for each of the lines to separate and analyze the changes in base level responsible for the sequences. The chronostratigraphic charts can be created by using a spread sheet on which the widths each of the numbered sequences is recorded and then display these widths as a chronostratigraphic chart
c. Can these be matched to a number of the 2nd and 3rd order events on the Haq et al 1987 sea level chart?

4) The tectonic setting of the Bahamas could be considered to be part of a foreland basin. To the south of the Bahamas the effect of subduction beneath Cuba might be expected to generate movement beside and beneath the Bahamas with resulting local changes in accommodation in the Neogene section displayed on the Western Geophysical Line. To this end the internal geometries of the clinoforms seen on the seismic line should be examined to see if a presence or an absence of small-scale tectonic control on the area can be detected.

Similarly a sediment supply would be expected from the folded and thrust areas of Cuba to the South. A deepening just south of the Bahamas would suggest regional tectonic subsidence and the development of extensive accommodation, while reduced accommodation and thinning over the adjacent cratonic fragment of the Bahamas would suggest more stable tectonic regime. To examine the magnitude of these tectonic effects measure the thickness of the updip carbonate shelf.

a. Are there any local variations in the thickness of onlapping shelf sediments that could be ascribed to a local tectonic signal?
b. Could a local tectonic signal have produced any of the downslope slumping?
c. Are there any regional variations in the thickness of onlapping shelf sediments or downslope downlapping sediments that could be ascribed to a regional tectonic signal? Are these in phase with the 2nd and 3rd order events on the Haq et al 1987 sea level chart or are these separate events?
d. Is any evidence of a regional tilt to the sedimentary fill penecontemperaneous with its deposition or is it post deposition?


home | about site | site contents | site map| submit a site | contact us | top
Copyright © 2009 SEPM (Society for Sedimentary Geology) All Rights Reserved
Last Revised: November 11, 2005