|
|
|
|||
|
Seismic
Sequence Analysis This is the second of the series of exercises tied to the interpretation of seismic data and its relationship to sequence stratigraphy described on the page below. Lines
12-81 Line
26-74 Line
27-81 Line
37-81 Proposed Sea Level Events
Evolution of Basin margin Mapping
the position of selected Nanushuk Group and Torok Formation clinoforms
observed in the seismic data set indicate the paleo-shoreline
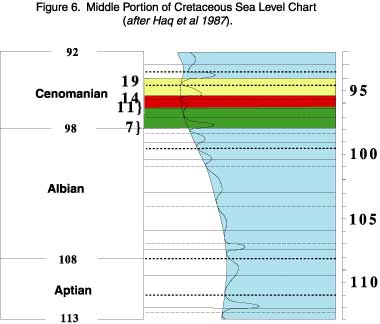
was oriented northwest southeast. Conclusions There was extensive tectonically driven accommodation developed in the Foreland Basin. Reduced accommodation on the adjacent cratonic fragment beneath the Barrow Arch to the north was overwhelmed by the sedimentation from the folded and over thrust Brooks Range to the South and the formation of clinoforms. There was a a deepening in the foreland basin to the SW and a shallowing to the NE over the Barrow Arch. Clinoforms can be seen becoming progressively younger to the north and east. The internal geometries of these clinoforms indicate an absence of small-scale tectonic control on the area. The variation in the thickness and distribution of the clinoform suggest that rate of sediment supply from the Aptian through the Cenomanian was variable in the NPRA. Such variation in shape and geometries are probably related to delta switching, and migration tied to the shifting of the source areas from the SW. Individual sequences show evidence of slumping, basin floor fans, slope fans, and onlapping high stand wedges. Major erosional events are seen on the seismic lines. This can be observed by comparing the interpretations on lines 27-81 (events 11-12), 37-81 (16-17), 12-81 (11, 14-15, &19) and 26-74 (7, 14-15, & 19) with the biggest erosional events above surface 7 and between surfaces 11 and 12. The biostratigraphy for the area is poor and so lithostratigraphy was used to identify the Nanusuk (sand prone unit), and the Torok (silt prone unit). On the basis of the biostratigraphy and their prograding clinoforms these lithostratigraphic units can be seen to young towards the north and east with the eastern portion of these deltaic wedges being assumed to be Cenomanian in age. On the Haq 1987 chart for the Cenomanian/Albian boundary there were three major type 1 unconformities (112 my, 109 and 107.5 my). |
|||